Predicting the global far-infrared SED of galaxies
using machine learning techniques
Galaxies emit across the whole wavelength spectrum
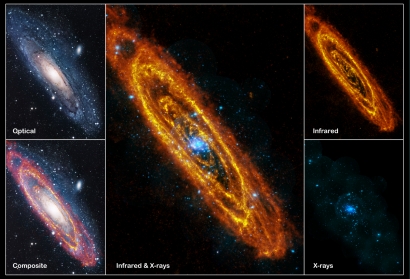
Andromeda from X-ray to far-infrared (FIR)
When we consider the total light at each wavelength, we talk about the spectral energy distribution (SED)
This is an example SED
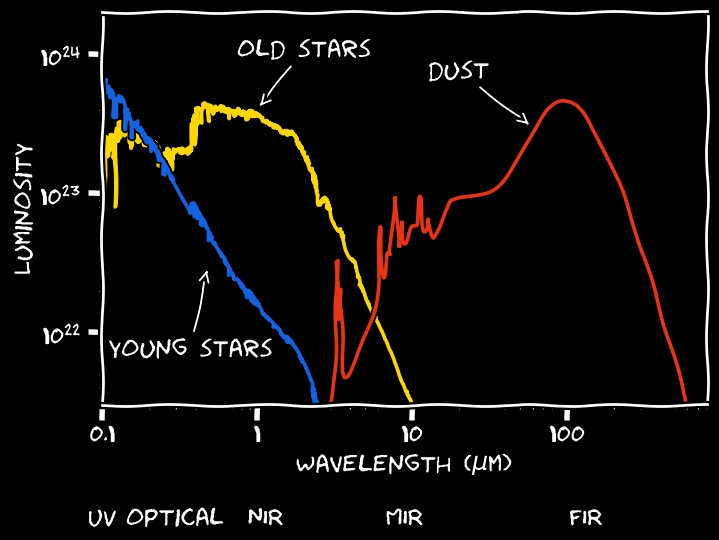
Hotter objects (such as young stellar populations, with temperatures above 10 000 K) emit at shorter wavelengths (i.e. higher photon energies) than colder objects (e.g. dust at around 20 K)
Stars are the primary source of emission
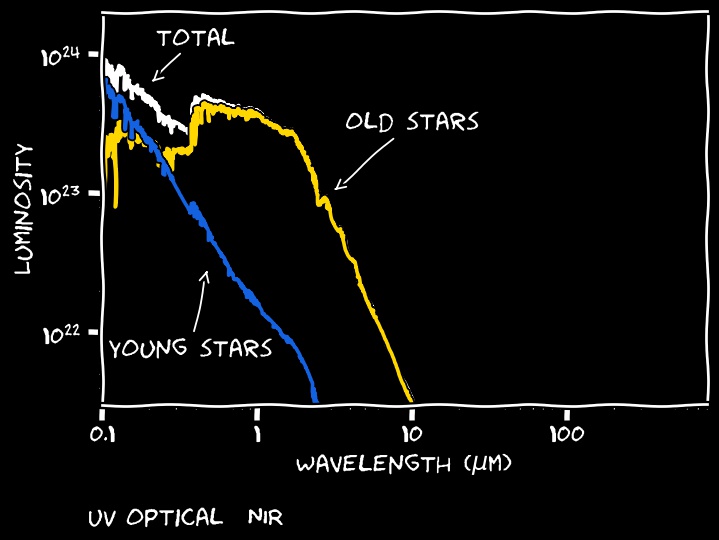
However, their emission is partially absorbed by dust
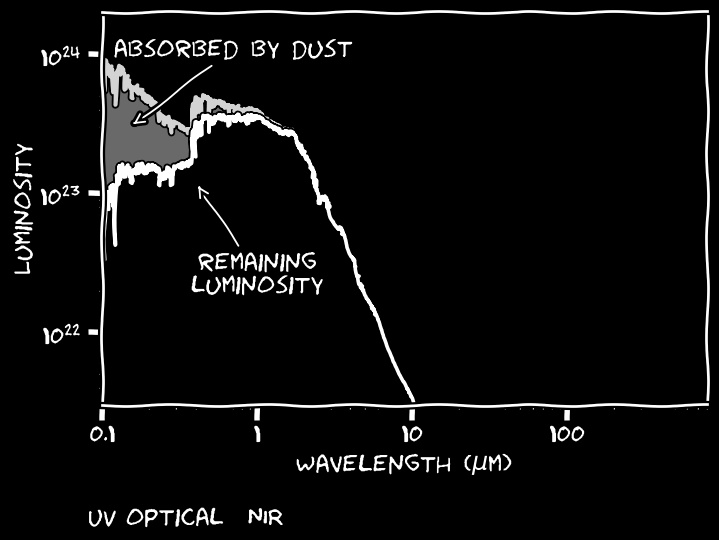
You might know this absorption from the Milky Way...

...but it can be very prominent in other galaxies as well
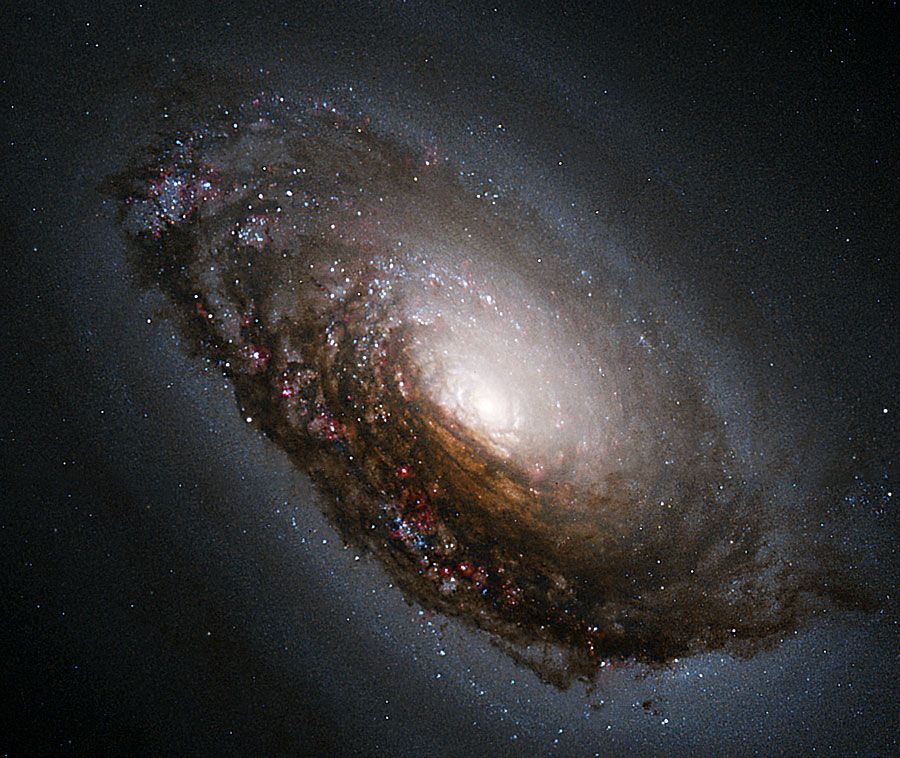
This is M64, the "black eye galaxy"
The absorbed radiation heats the dust (to about 20 K), which then emits thermally.
If the dust is in thermal equilibrium, the total absorbed energy equals its total emitted energy.
This is known as the dust energy balance
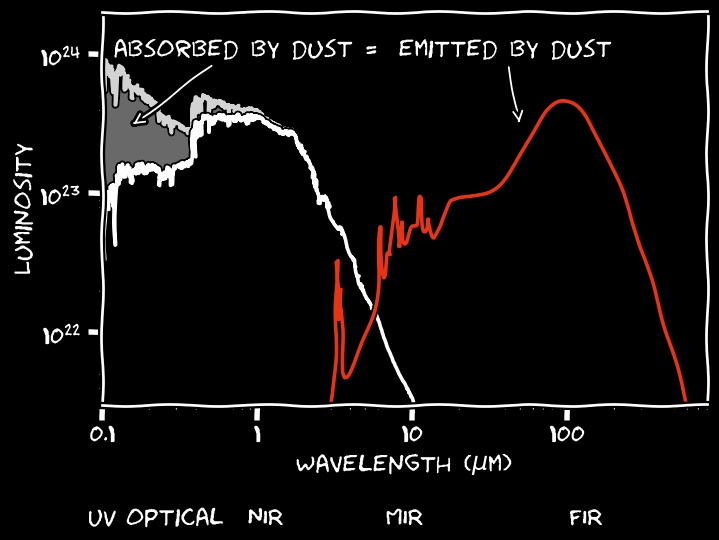
Unfortunately, observing the full spectrum from ultraviolet (UV) to far-infrared (FIR) is currently impossible...
The SEDs shown so far were models, not actual observations
Instead, we often observe through a few broadbands, like this:
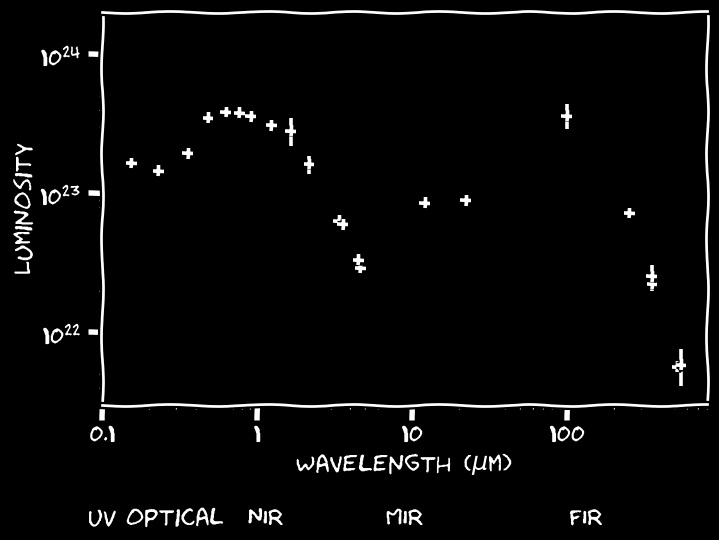
This galaxy is quite close (~100 million light years), and hence the errors are small: for many galaxies the observations are of lower quality.
Now, we can fit a model through the observed fluxes
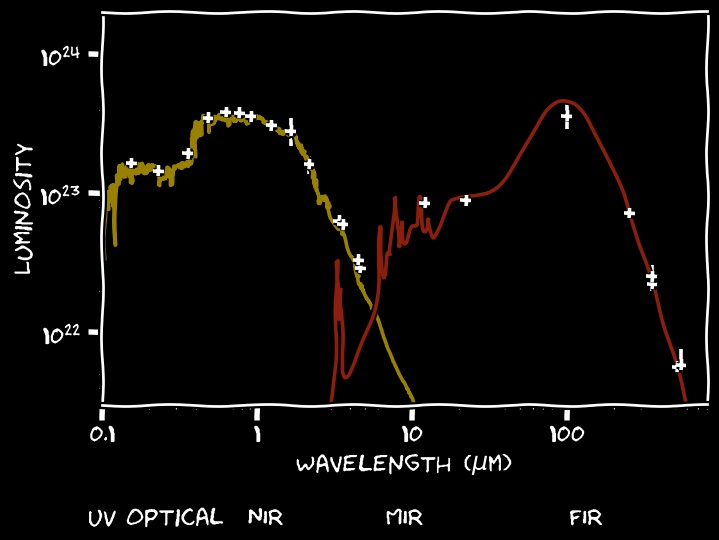
Energy balance can help constrain the models
Unfortunately, observing from UV to FIR is not straightforward.
For example, FIR radiation is absorbed by the earth atmosphere, and hence observing in the FIR requires expensive space missions.
For many galaxies, we lack FIR observations.
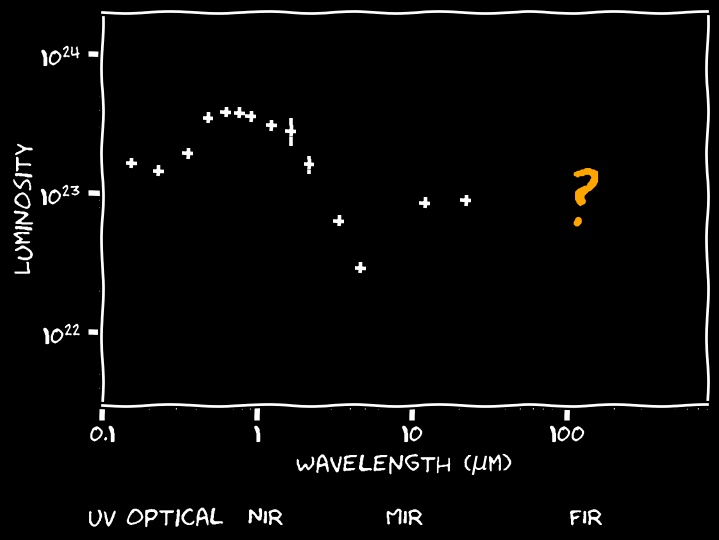
So my main research question is:
Can we learn about the dust properties if we lack FIR observations?
Specifically, the
- dust mass
- dust temperature
- FIR luminosity
typically require FIR observations.
The main idea is to use a UV-FIR dataset as a blueprint for a machine learning algorithm.
Input: UV-MIR broadband luminosities
Output: dust properties and FIR luminosities
By repeatedly showing examples of both input and output (supervised learning), the algorithm learns to predict the correct output.
So here are the results...
Some of the predictions (orange) compared to the ground truth (red)

We take the 30th, 50th and 70th percentile when ordering by prediction quality (RMSE)
Dust properties: predicted vs true
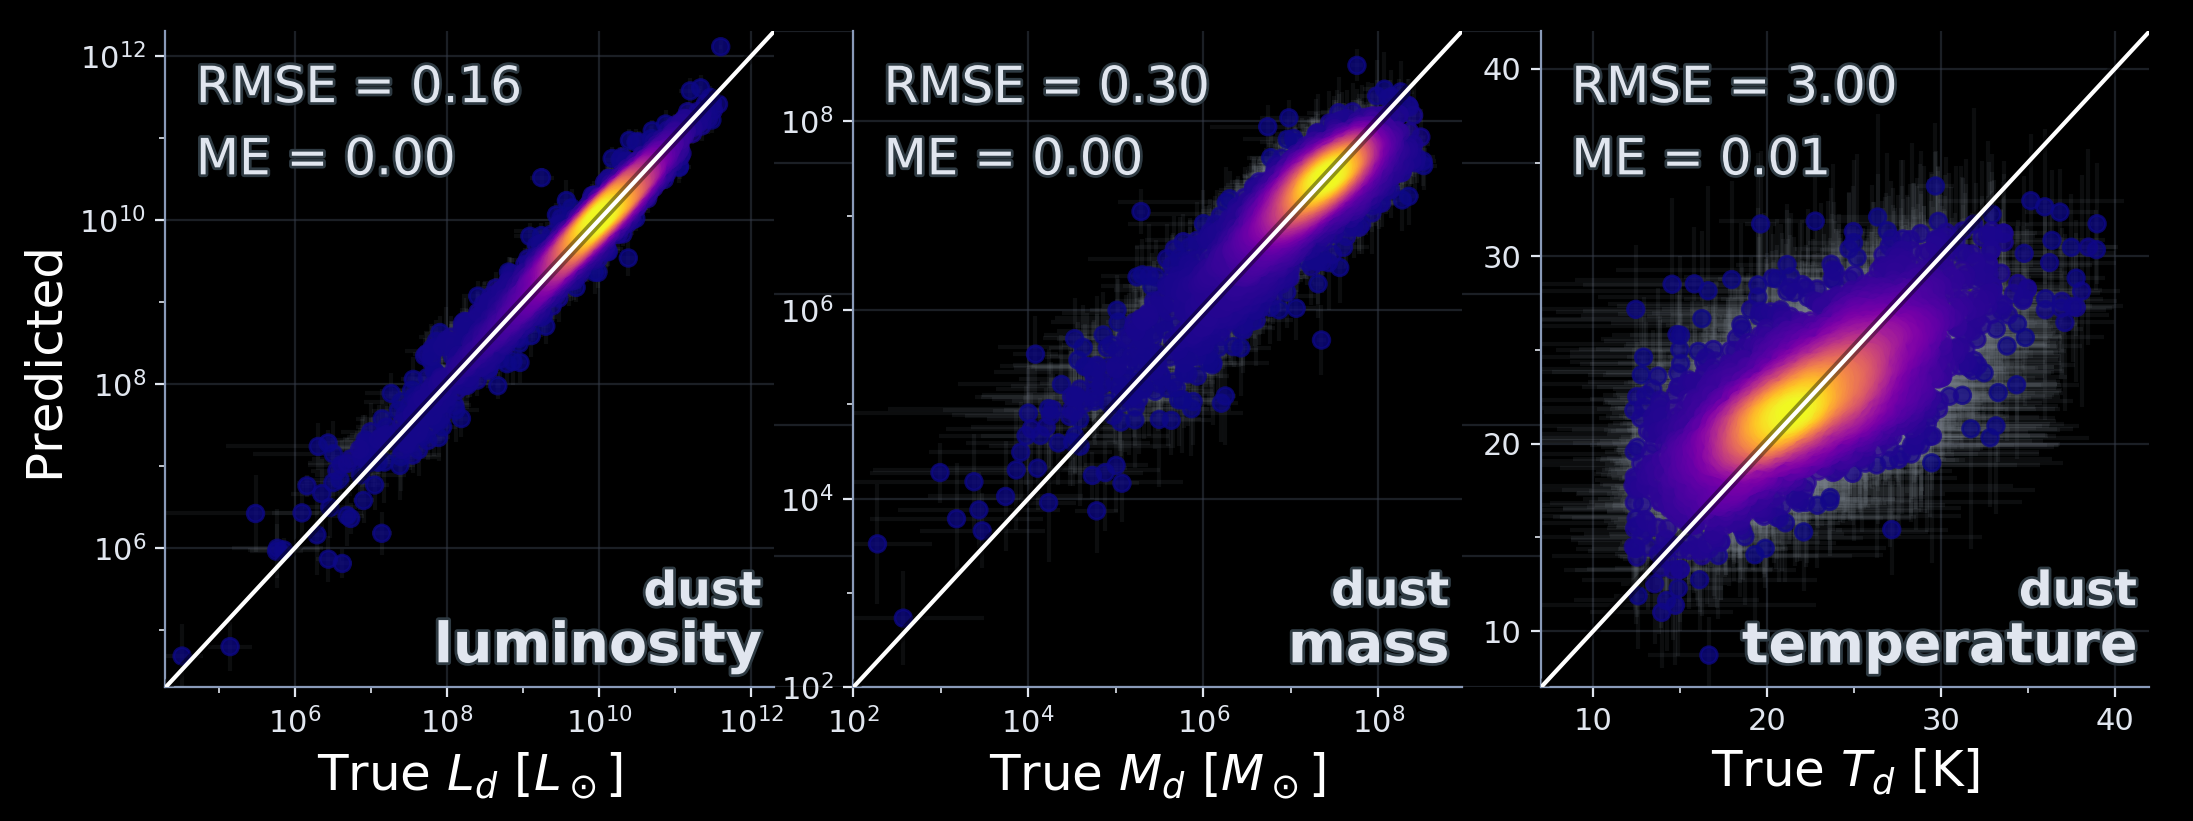
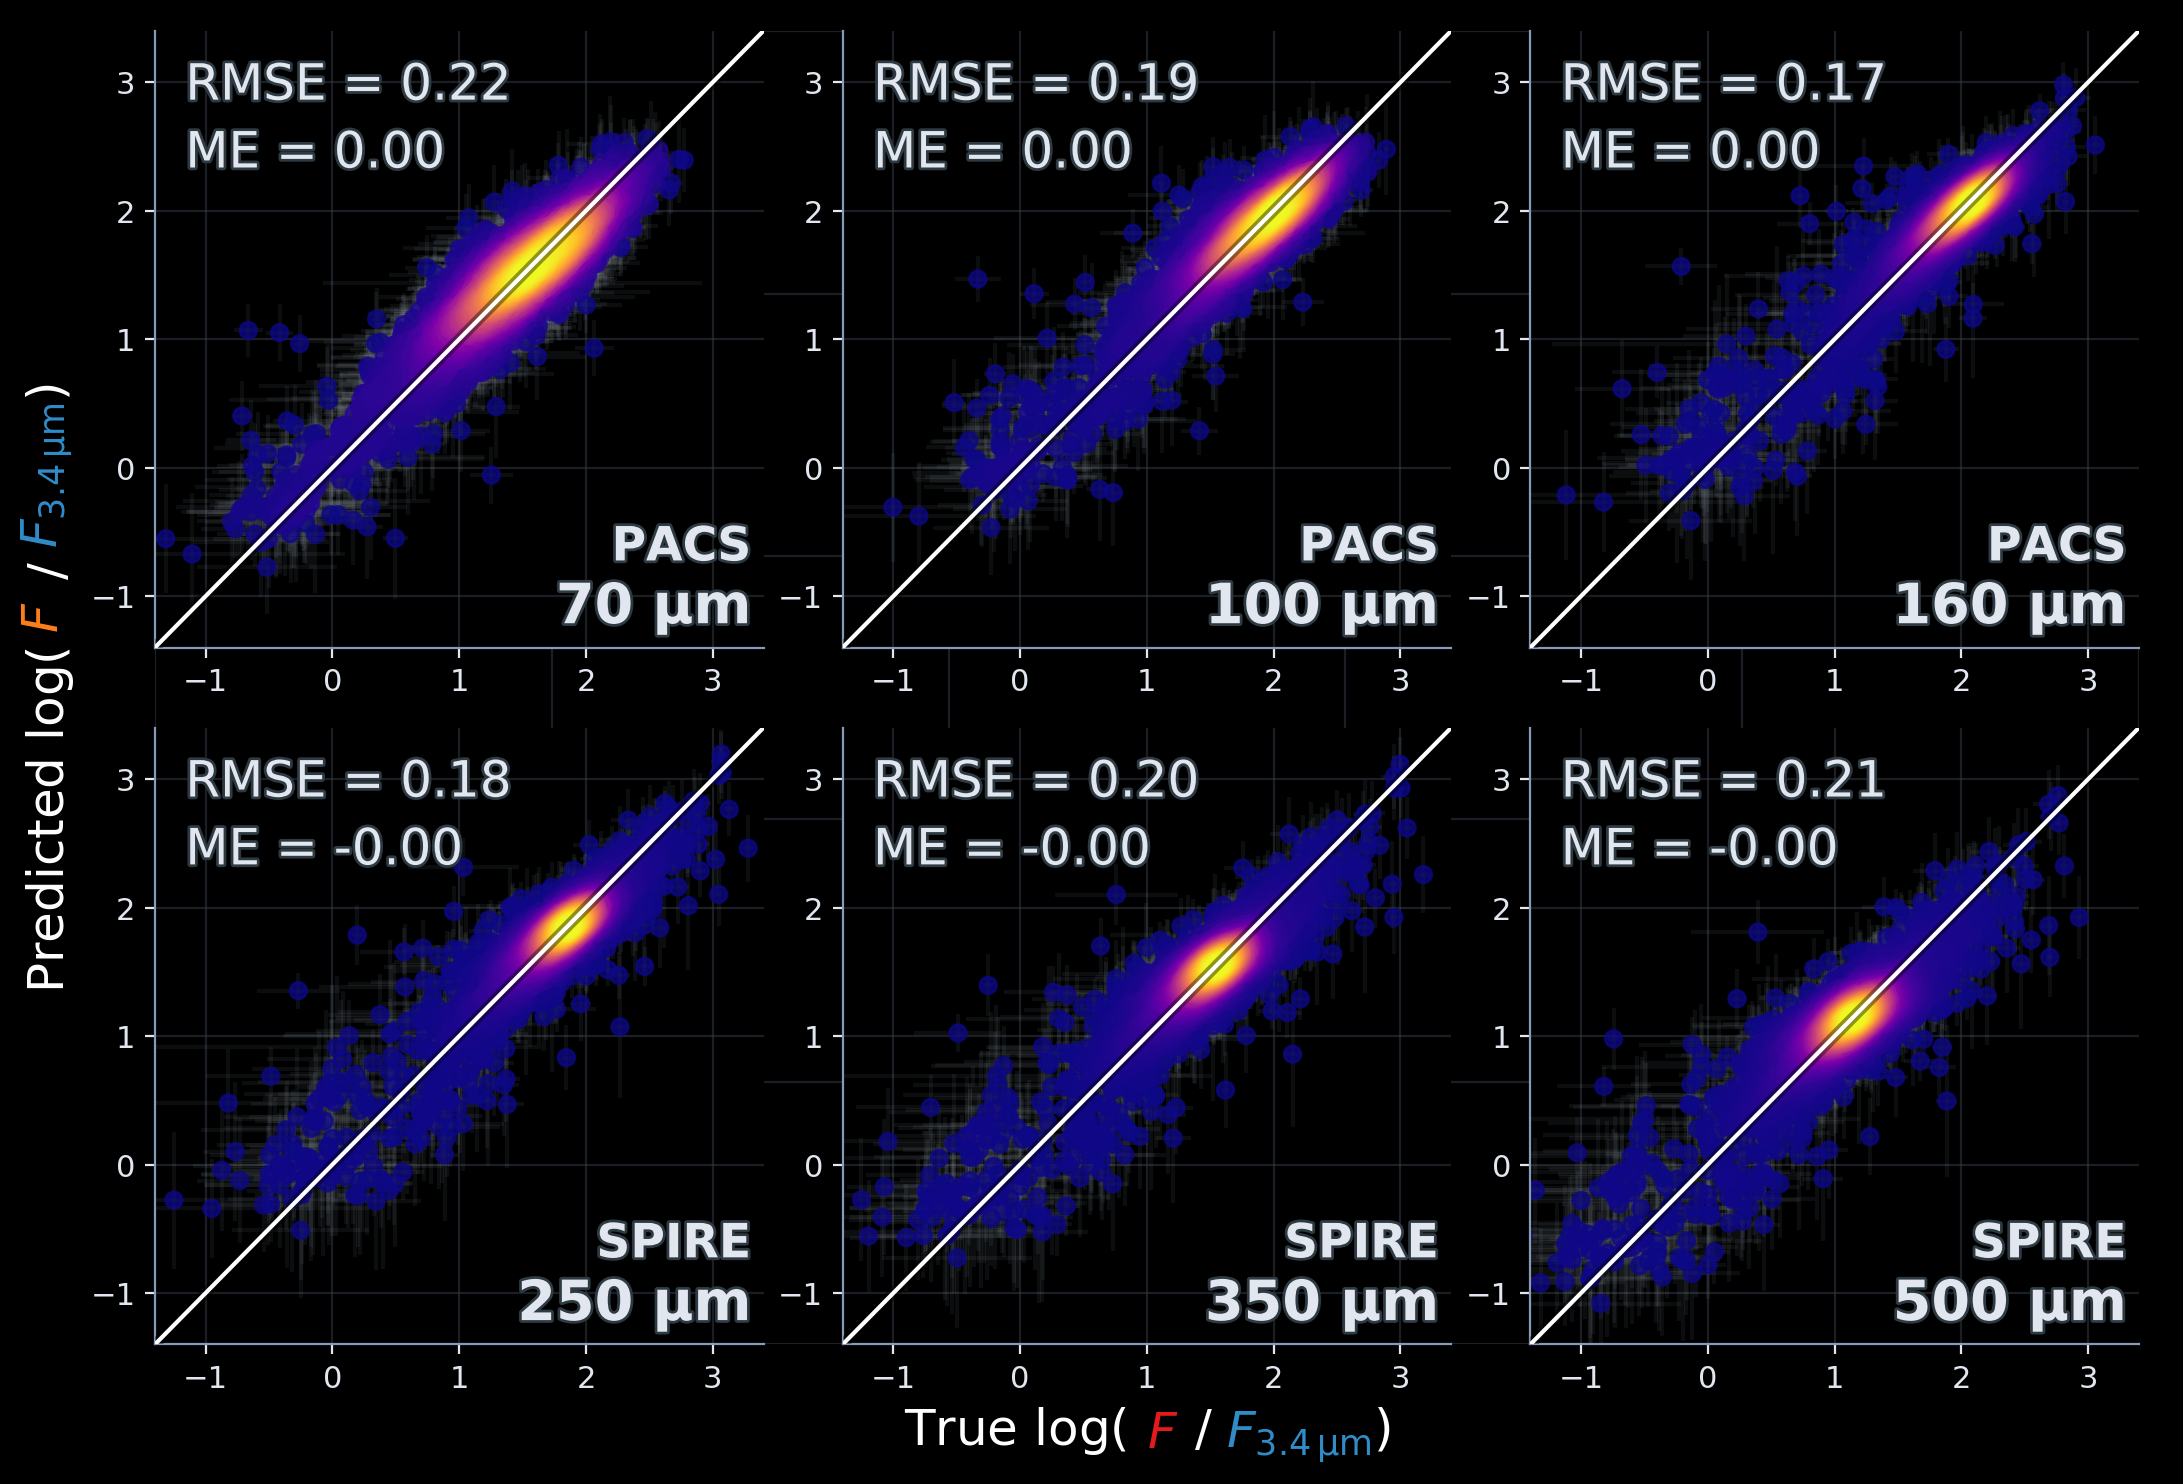
FIR fluxes: predicted vs true
